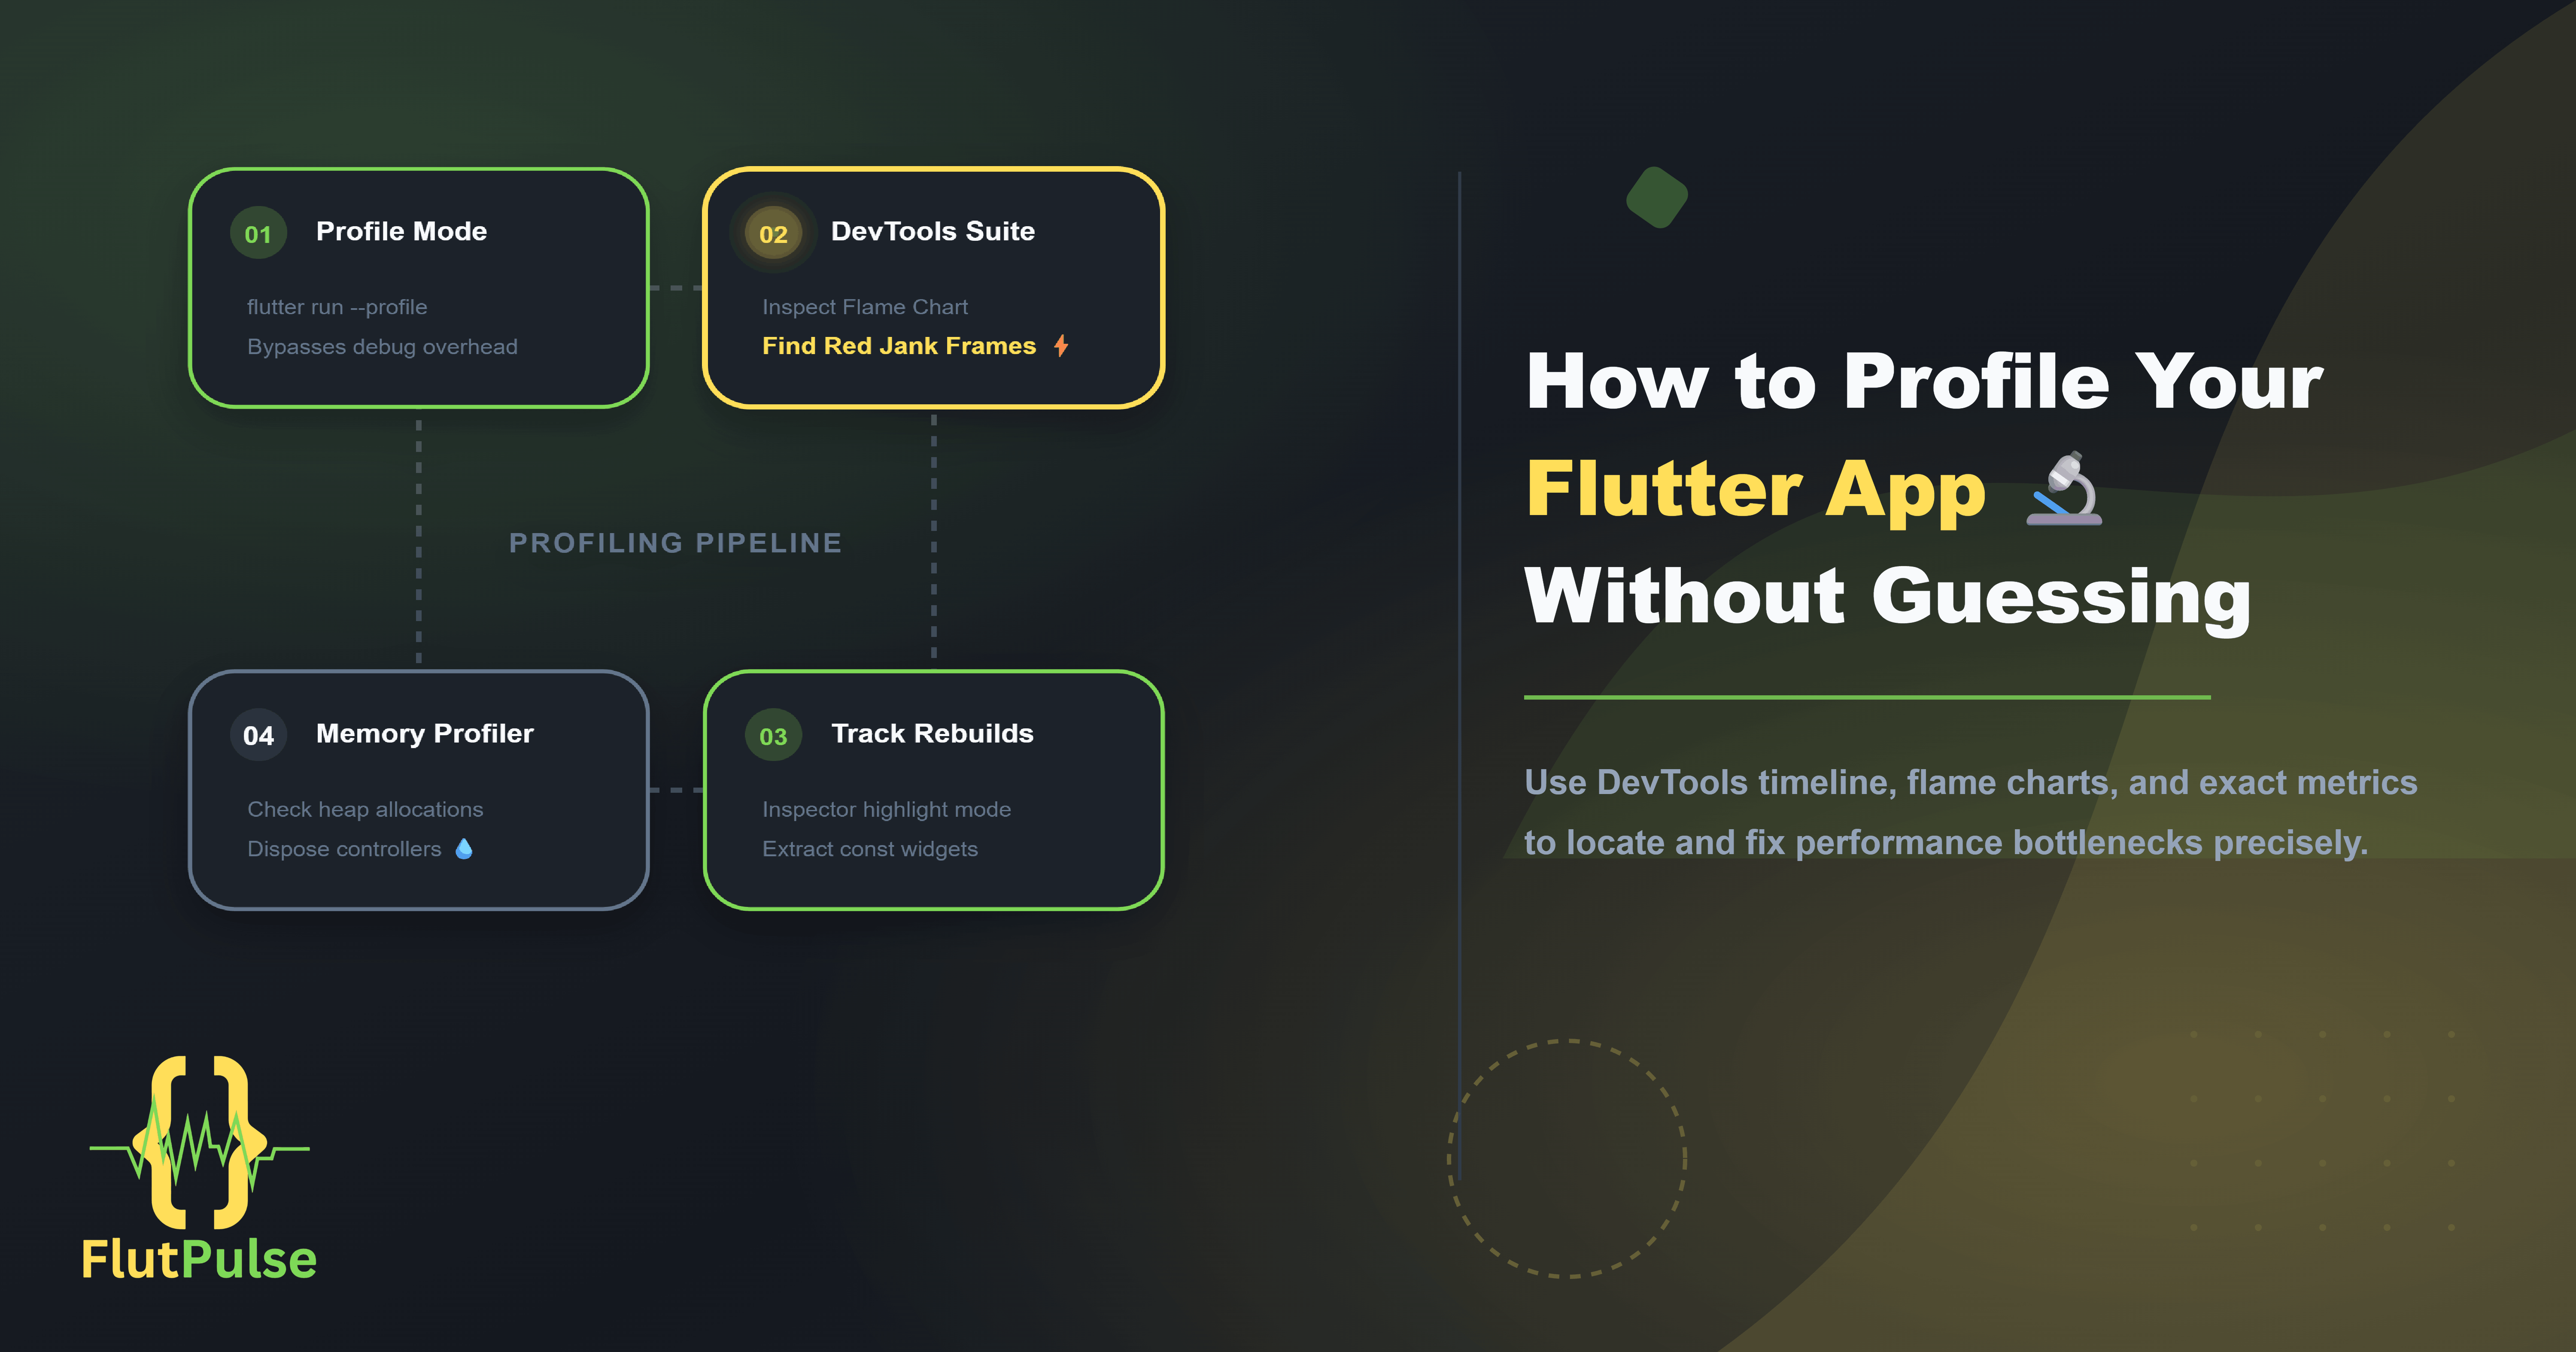
How to Profile Your Flutter App Without Guessing 🔬
Published on: August 28, 2026
Introduction
When a Flutter app feels slow, most developers start guessing. They add const here, remove a setState there, and eventually hope something improves.
Guessing is expensive. It wastes time and often misses the actual problem.
Flutter DevTools gives you precise, visual data on exactly where your app is spending time. Learning to read it is one of the highest-value skills in Flutter development.
Always Profile in Profile Mode
Before opening DevTools, launch your app in profile mode:
flutter run --profile
Debug mode includes instrumentation overhead that distorts performance data. Profile mode gives you release-level performance while keeping DevTools connectivity.
Never make performance decisions based on debug builds.
Opening DevTools
When you run with --profile, the terminal shows a DevTools URL:
Flutter DevTools, more info at https://dart.dev/tools/dart-devtools.
An Observatory debugger and profiler on iPhone 14 is available at:
http://127.0.0.1:9102/...
Open it in Chrome. You’ll see the DevTools panel with multiple tabs.
Alternatively, in VS Code: Cmd+Shift+P → Flutter: Open DevTools.
The Performance Tab: Your Primary Tool 📊
The Performance tab shows a timeline of your app’s rendering activity. Start recording, interact with the part of your app that feels slow, then stop.
You’ll see two critical rows:
- UI thread — Dart code execution time
- Raster thread — GPU rendering time
Each frame should complete in under 16ms (for 60fps) or 8ms (for 120fps).
Frames that exceed this threshold are shown in red — those are your jank frames.
Reading the Flame Chart
Click a red frame in the timeline to see a detailed breakdown.
The flame chart shows a call stack of what was executing during that frame. The wider the bar, the longer it took.
Look for:
- Wide bars in your own code — methods you wrote that are slow
- Repeated deep call stacks — expensive operations being called too often
- Layout/paint calls — widgets triggering unnecessary layout passes
build() → Column.build() → ListView.build() → YourExpensiveWidget.build()
If build() appears wide in the chart, you have an expensive build method that needs optimizing.
The Widget Rebuild Inspector 🔁
In the Flutter Inspector tab, enable Track Widget Rebuilds.
This highlights widgets in your app visually — red for frequent rebuilds, blue for infrequent ones. Widgets that shouldn’t be rebuilding but appear red are your first optimization targets.
Common culprits:
- Widgets placed inside
build()methods that could be extracted and markedconst - Widgets listening to a state object but only using a small part of it
- List items rebuilding when the underlying data hasn’t changed
Memory Profiling: Catching Leaks 💧
Switch to the Memory tab and record a session. Look for:
- Heap size growing continuously — memory leak, often from unDisposed controllers or streams
- Spikes during specific interactions — expensive allocations that could be pooled or cached
Common memory leaks in Flutter:
// ❌ AnimationController not disposed — leaks memory
class _MyWidgetState extends State<MyWidget>
    with SingleTickerProviderStateMixin {
  late AnimationController _controller;

  @override
  void initState() {
    super.initState();
    _controller = AnimationController(vsync: this, duration: ...);
    // Missing: dispose()
  }
}

// ✅ Properly disposed
@override
void dispose() {
  _controller.dispose();
  super.dispose();
}
Network Profiling
The Network tab logs all HTTP requests your app makes — URLs, response times, status codes, and payload sizes.
Look for:
- Repeated identical requests — missing caching
- Large payloads — images or data that could be compressed or paginated
- Slow requests — API calls blocking the UI (these should always be async)
The CPU Profiler for Dart Code
The CPU Profiler tab lets you record and inspect exactly which Dart functions are consuming CPU time.
Sort by exclusive time — the time spent inside a function itself, not counting its callees. High exclusive time identifies the actual hot path, not just the call chain that led to it.
A Practical Profiling Workflow
- Run in profile mode
- Open DevTools → Performance tab
- Record while performing the problematic interaction
- Find red frames in the timeline
- Click the worst frame → examine flame chart
- Identify the widest bar in your own code
- Optimize that specific function
- Record again to verify improvement
Repeat until all interactions stay under 16ms.
Conclusion
Performance optimization without data is just trial and error.
DevTools turns performance debugging into a precise discipline. You don’t need to guess where your app is slow — you can see it, frame by frame, function by function.
The first time you use DevTools properly, you’ll wonder how you ever profiled a Flutter app without it.